Statistics and Reports
Imagicle Advanced Queuing administrators can analyze the details of managed calls, performing some statistics on the available data.
Imagicle Advanced Queuing stores in the database a Call Detail Record (CDR) for each call managed by a queue. Such CDRs include following information:
Date-Time of call arrival
Caller Number
Queue name: the queue that has been called
Waiting time: the time that caller has waited in queue.
Conversation time: duration of the conversation with the agent (available if the agent is CTI-monitored)
Destination number (Served by): the call has been transferred by Advanced Queuing to this number, typically a agent
Classification: this is the outcome of the call. see below for details.
Termination reason: the detailed reason for call termination.
Logged agents: the total number of logged agents at the moment the call entered the queue.
Waiting Calls: the total number of waiting calls at the moment the call entered the queue.
Record Id: needed for diagnostics only. Useful to locate the call in log files.
Each CDR includes the call classification, that is the final treatment applied to the call. Possible values are:
Unassigned: unknown, could appear only in the case of a fault or unexpected behaviors.
Off Schedule: the call arrived when the queue was closed.
Refused: the call has been disconnected by the system.
Abandoned: the call has been disconnected by the caller, while waiting in queue.
Timed out: the call waiting time exceeded the maximum waiting time (the call has been disconnected or trasferred).
Served: the call has been answered by an agent.
The termination reason field describes with more details the reason of call termination, that is when the call classification is Refused. This field is valued only when a particular scenario occurs and the application is programmed to refuse the call or when there are no more resources (licenses) to manage the call. E.g. when licensed channels are exceeded, the behavior “queue full” is triggered.
Possible values for this field are:
Unassigned: this applies when the call classification is different form Terminated.
Queue full: the incoming call caused an overflow; or the licensed channels are exceeded
No available agents: the call has been disconnected because no agents were available when the call came in queue.
Resources exhausted: no more licenses are available to manage the call.
CDR Data Retention
Administrator can configure Advanced Queuing CDRs data retention from web portal: Advanced Queuing ⇒ Default Settings ⇒ Queue Settings ⇒ Global System Settings. Default value is 731 days.
Time indication
All call start times are referred to the Imagicle server timezone.
For instance, if the server is configured on the USA EST timezone and a queue is configured on the UK London timezone, calls handled by such queue will be reported as arrived 5 hours behind the queue local time.
This time shift must be considered when reading a call details report and when applying a time filter.
Running the Reports
The Reports can be accessed through the web interface selecting the link on the Advanced Queuing menu.
Through the web interface, you can launch the following queue-based reports:
Call Volume Analysis: shows number of calls and wait duration per queue and per outcome
Time Analysis: analyzes waiting time per queue
Trends: show the number of calls per outcome and time trend
Trends for Avg Wait Time: shows average waiting time per outcome and time trend
Service level: analyzes service quality for each queue
Busy Channels Analysys: Shows peak, maximum and average number of channels used by Advanced Queuing over time, in 30 minutes intervals.
Call List: shows call details records of all traffic managed by Imagicle Advanced Queuing.
Interactive Call Detail Analysis
and the following agent-based reports:
Agent analysis: Analyzes the agent activity by queue
Agent Activity: Shows agents' activity detail records
Interactive Agent Activity Log: Shows agents' activity detail in an interactive grid
Each report page is divided in two sections. The upper parts allows you to filter (restrict) the results selecting a group of relevant parameters (e.g. call arrival time, queue, waiting time...). The lower part shows the result, including graphics when available.
Once generated, each report can be exported in Excel, Word or PDF format, and also scheduled.
Interactive Call Detail Analysis report
Interactive Call Detail Analysis allows you to dynamically group and filter the call records. Here is how to do it:
First of all, select a time range for the calls you want to analyze
To filter the records, use the drop down lists in the column headers
To group data by a specific column, just drag it to the bar at the top of the grid
A checkbox allows to enable the extended version, showing all the fields
You can group by one or more column. When data are grouped, the total number of calls and the average values are calculated per group.
Filtering data
The table header include filtering capabilities for the data. Different column filters can be combined to extract the interesting portion of data. For example, setting a filter on the Queue column and on the Classification column, will extract all CDRs related to that queue, with selected classification.
Changing any of the parameters will update the report contents. CDR are reported in the order they have been generated by QME (descending order).
In the sample image below, you can see CDRs related to calls served by "Vicini Sonia" and subsequently transferred to ext. 999, grouped by date.
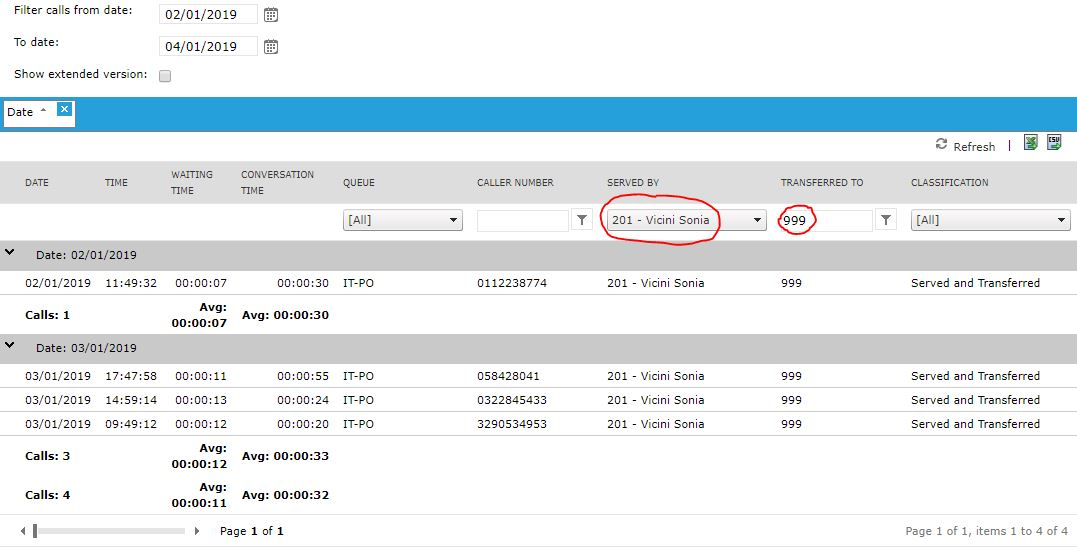
Once generated, this report can be exported to Excel or CSV format.
Agent Analysis and Activity reports
The Agent Analysis report shows
Answered calls
Unanswered calls
Short calls (<10 secs.)
Avg answer time
Maximum answer time
Average conversation time
Maximum conversation time
Total conversation time
Ready time
Wrapup time
Pause time
Login time
Data can be filtered per date, agent and queue.
Once generated, each report can be exported in Excel or PDF format, and also scheduled.
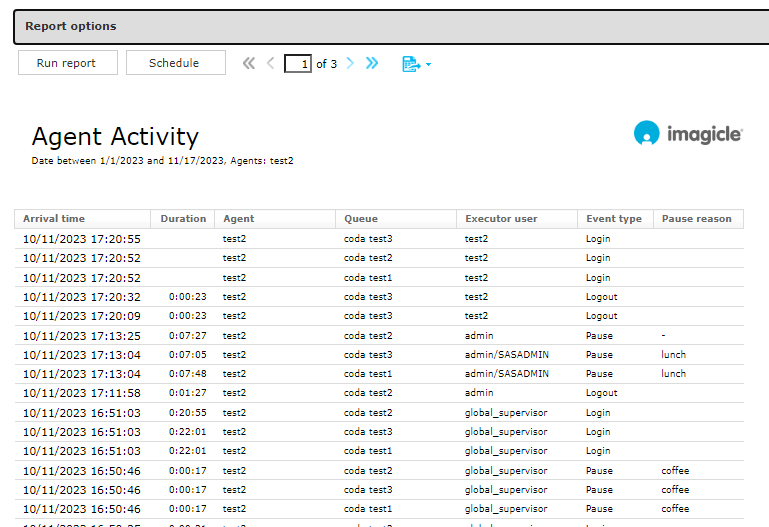
The Agent Activity report shows the following events:
Date/time of activity start
Activity duration
Involved Agent
Involved Queue
Activity Executor user
Event type
Pause reason
Data can be filtered per date, agent, queue and pause reason. See below sample:
Interactive Agent Activity Log report
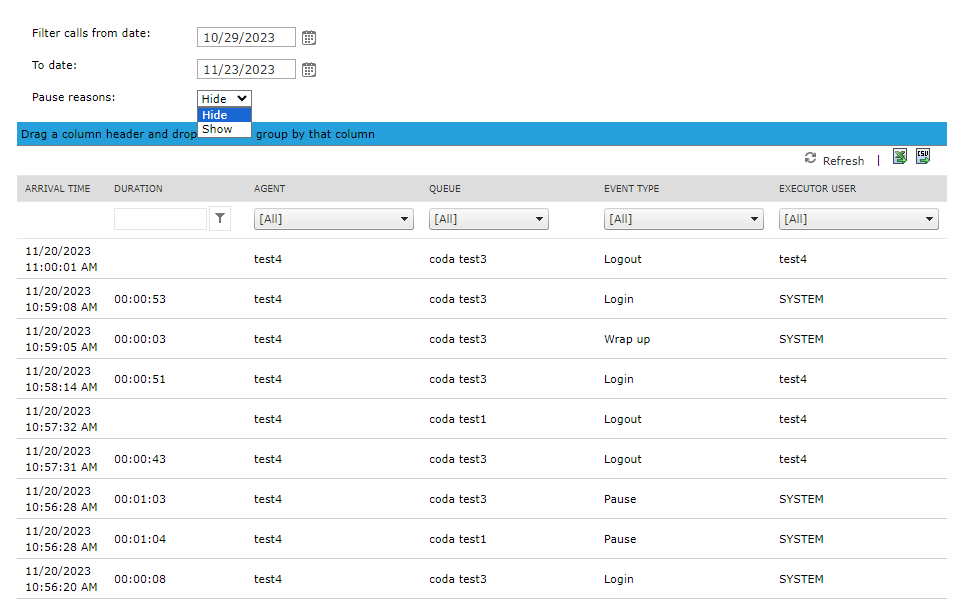
Interactive Agent Activity Log allows you to dynamically group and filter the agents' activities. Here is how to do it.
First of all, select a time range for the activities you want to analyze
To filter the records, use the drop down lists in the column headers
To group data by a specific column, just drag it to the bar at the top of the grid
A checkbox allows to enable pause reason display in the rightmost column, with relevant pull-down filter menu.
You can group by one or more column. When data are grouped, the total number of entries and the average event interval are calculated per group.
Reports Scheduling
Scheduled reports are executed periodically and sent via e-mail.
To schedule a report, setup the filtering options and run it from the web interface. Once you are satisfied with the result, press the "schedule" button. You'll be asked when the report must be automatically executed, and the recipients' e-mail address check or edit these settings later, through the Scheduled Reports web page.