Supervisors' Real Time Dashboard
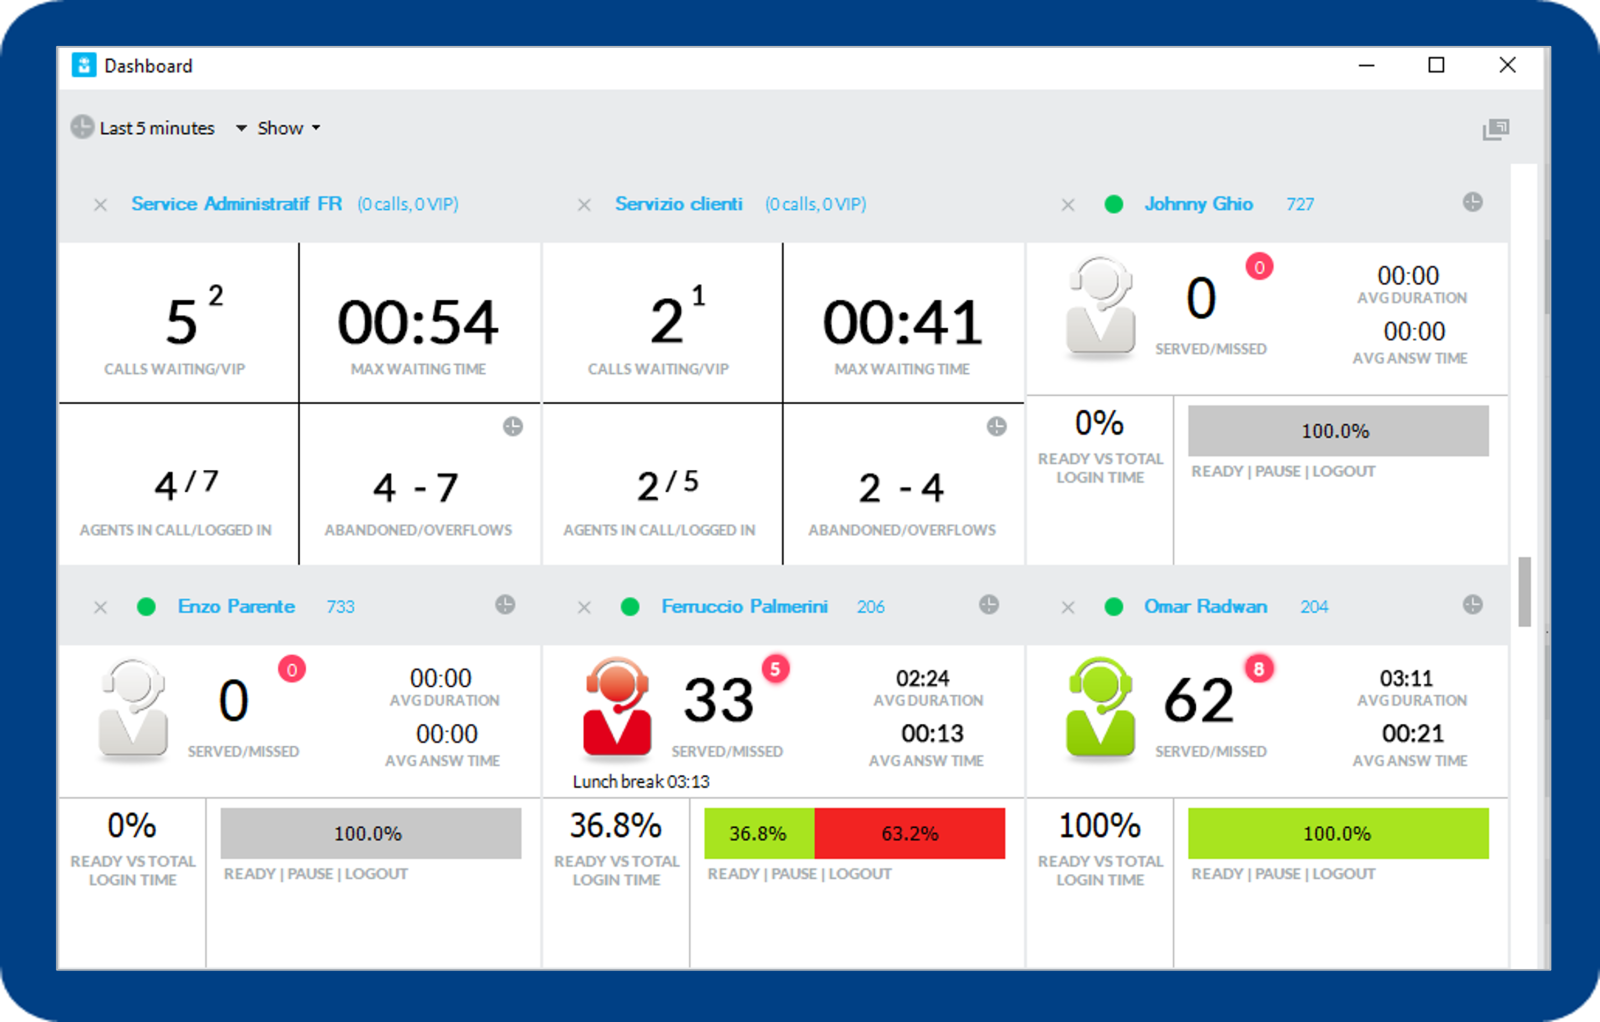
A supervisor monitoring the performance of own agents and the volume of calls hitting each queue can leverage an essential tool included into Imagicle UCX Agent Console and UCX Attendant Console Enterprise called "Dashboard".
This is a tab embedded into main graphical interface, which can be detached to a separate window for full screen display in Supervisor's workstation or into a large LCD panel in the Contact Center room.
Dashboard embedded panels
Attendant Console Dashboard includes several panels. Each supervisor can hide/unhide each of them, for a customized view of the needed information. Please consider that all displayed cumulative values are always referred to time interval configured in the top-left pull-down menu (5 minutes in above sample). Here is a brief description of each Dashboard panel:
Queue Panel
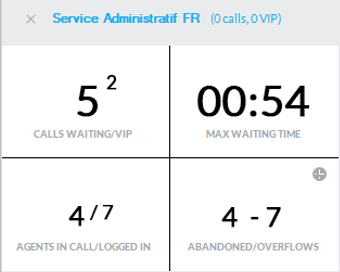
This panel appears for each queue monitored by the Supervisor. It includes the following real time data:
CALL WAITING: How many calls are currently placed in the waiting queue
VIP: How many VIP contacts calls are currently placed in the waiting queue
MAX WAITING TIME: This is the highest waiting time reached during the configured interval.
AGENTS IN CALL: How many agents are currently in a call, coming from this queue.
LOGGED IN: How many agents are currently logged in to this queue.
ABANDONED: How many inbound calls have been remotely disconnected during the configured interval, due to remote party impatience.
OVERFLOWS: How many calls have been overflown to another destination (queue, IVR, VM, etc.) during the configured interval.
Agent Panel
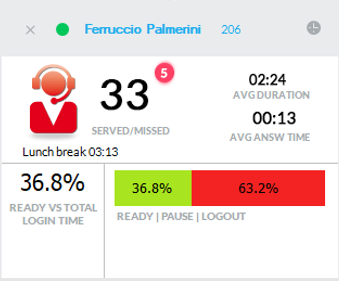
This panel appears for each agent monitored by the Supervisor. It includes the following real time data:
Agent icon: Red when in pause or during wrap-up time; Grey if logged out; Green if logged in

SERVED: How many calls have been served by this agent, during the configured interval.
MISSED:How many calls have been missed by this agent, during the configured interval.
AVG DURATION: Average call duration, calculated for the configured interval.
AVG ANSW TIME: Average answering time, calculated for the configured interval.
READY VS TOTAL LOGIN TIME: This percentage is calculated by considering the whole login time period vs. pause period(s), always considering the configured interval.
READY | PAUSE | LOGOUT: This bar chart represents the percentages of login vs. pause vs. logout time, always considering the configured interval.
Agents on call Panel
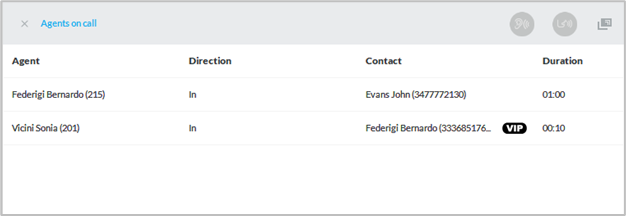
This panel provides a list of ongoing calls performed by monitored agents. For each call, the following real time data is displayed:
Agent: Agent's name, surname and phone number
Direction: In=inbound call; Out=outbound call
Contact: Remote party phone number; if included into a Contact Manager directory: name and surname.
Duration: ongoing call duration
In panel's top header, there are two buttons to trigger Silent Monitoring and Whisper Coaching features (Cisco UCM only).
All Agents Panel
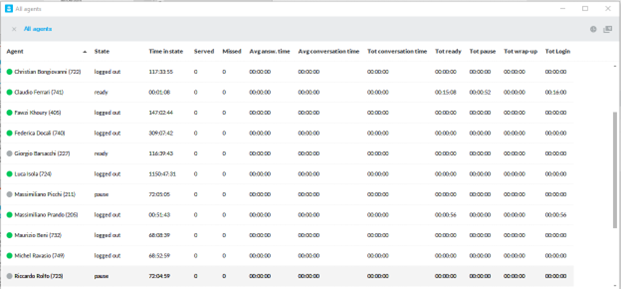
This panel provides several counters (KPIs), very useful to evaluate each monitored agent's performances. For each agent, the following real time and cumulative data is displayed:
Agent: Agent's name, surname and phone number
State: current login status
Time in state: since how long the agent is in above login status
Pause reason: The reason for being paused (populated only when State=pause)
Served: volume of server calls
Missed: volume of missed calls
Avg answ: Average answering time
Avg dur: Average call duration
Tot talk: Total conversation time
Tot ready: Total time in Ready (logout) status
Tot pause: Total time in Pause status
Tot wrap-up: Total time spent in wrap-up status
Tot Login: Total time in Login status
All Queues Panel
This panel provides a summary view of all monitored queues, including several counters related to handle calls. For each queue, the following counters are displayed:
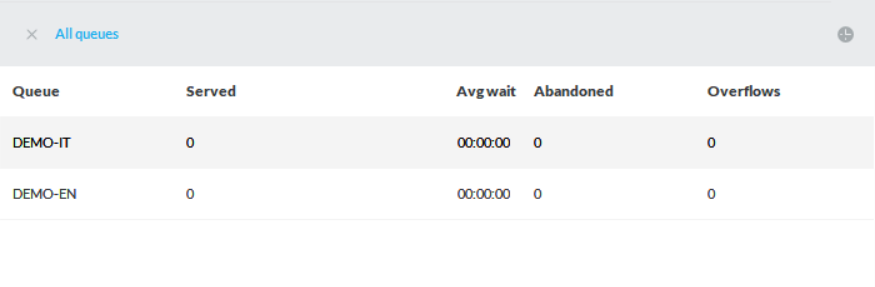
Queue: Queue name
Served: Volume of served calls, during the configured interval.
Avg wait: Average waiting time, during the configured interval.
Abandoned: Volume of abandoned calls, during the configured interval.
Overflows: Volume of overflown calls, during the configured interval.