Home and Dashboard web portal pages
Home page
Each user accessing to Call Analytics web menu is redirected to the “Home” page. This web page is refreshed every 20 seconds and it shows the following information:
Top 20 incoming/outgoing calls performed by the user through own phone device. For each call, it is available time stamp (based on default time zone), call duration, cost and involved gateway.
A summary dashboard with total number of answered calls and missed calls, total costs and average conversation time.
Shortcuts to most used public/personal reports.
Below you can see a Call Analytics Home page sample.
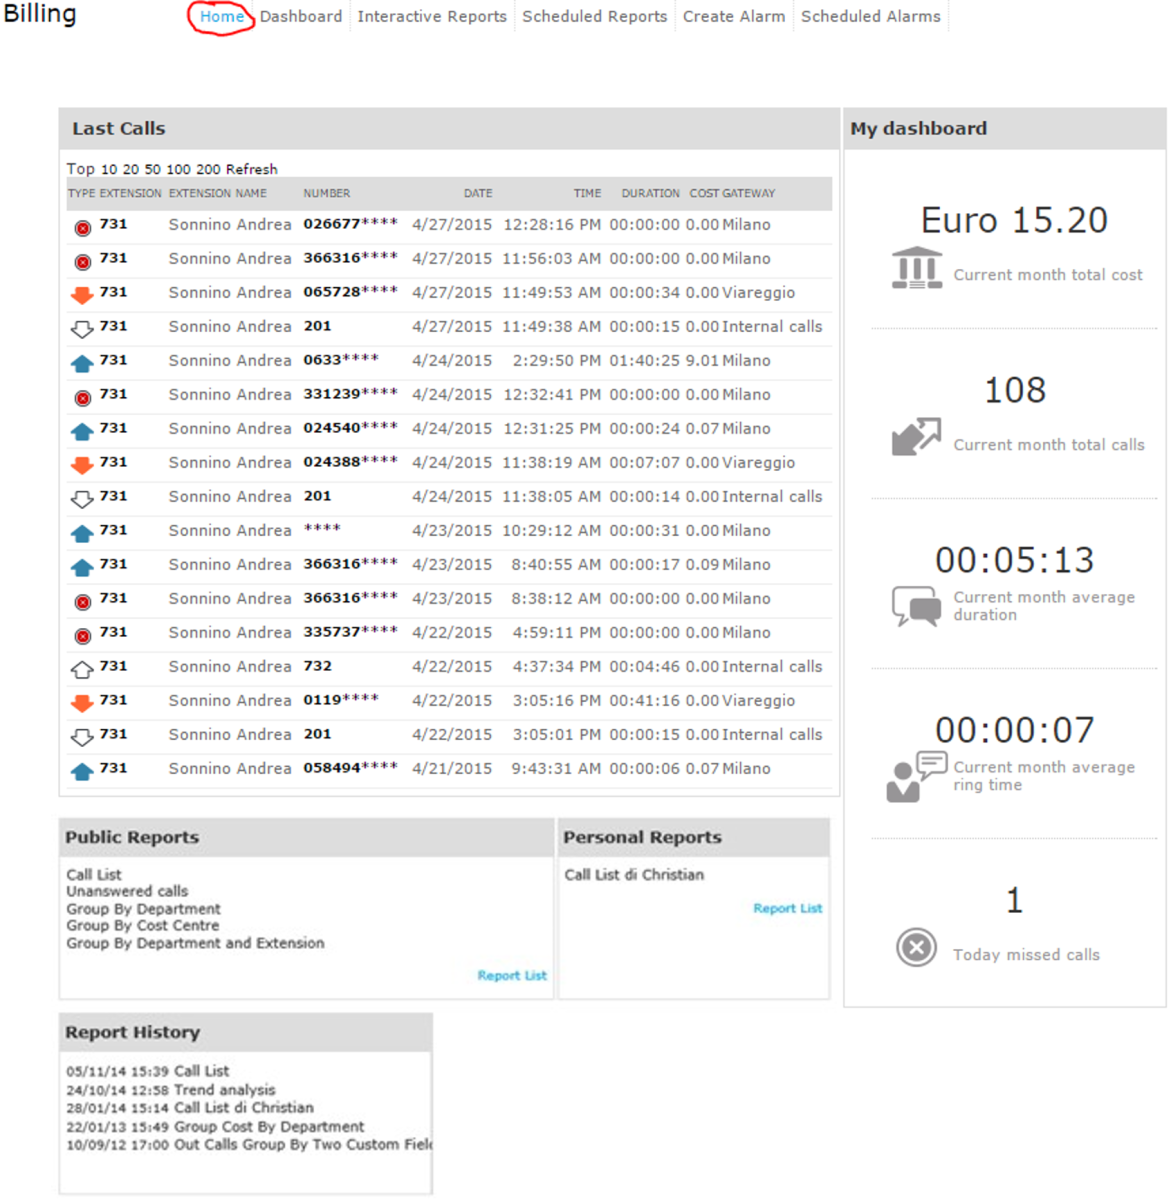
First column “TYPE” shows call direction/type, as described in below list:
![]() Incoming call from PSTN
Incoming call from PSTN
![]() Outgoing call to PSTN
Outgoing call to PSTN
![]() Missed inbound or outbound call
Missed inbound or outbound call
![]() Internal call (always documented twice)
Internal call (always documented twice)
Pls. note that PSTN called/calling party numbers might be partially hidden by asterisks, for privacy reasons.
By clicking on any internal/PSTN bold phone number available into Last Calls list, a filtered report will be automatically launched, listing all calls performed by the user from/to that specific phone number.
Dashboard
Next Call Analytics web menu item is the “Dashboard” page. This user’s customizable web page shows statistical data related to user’s phone traffic, based on default time zone. You can add/remove dashboard’s “Widgets” of your choice and decide where to place them on screen, too. See below sample:
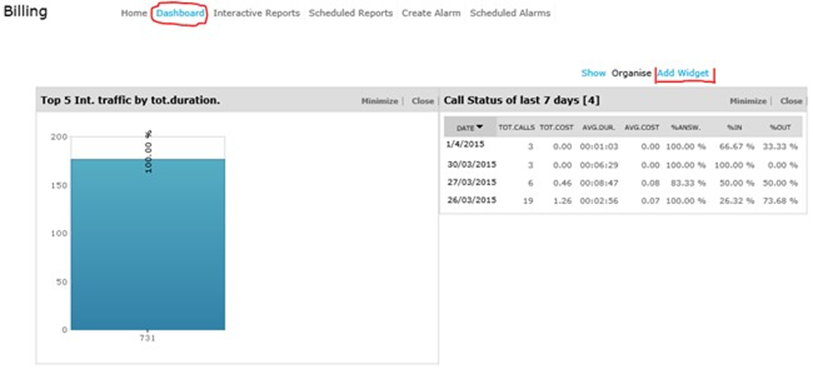
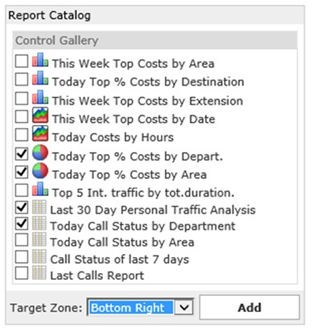
Each widget can be removed by clicking on relevant “Close” option, or it can be minimized (reduce to a single line) by clicking on “Minimize” button.
To add a new widget, just click on “Add Widget” and flag those you wish to appear on dashboard, specifying target screen area using relevant pull-down menu: