Monitoring Service
Imagicle UCX Suite includes a monitoring services which can send alerts to the system administrator when an event occurs. Examples of monitored events are:
Insufficient disk space
An Imagicle service failing
Low database space
Bad service performance
License issues
License overcome (e.g. calls dropped in Advanced Queuing due to not enough licensed channels)
Authorization issues related to Webex Calling MT tokens
The monitoring service includes auditing features. The list of events can be displayed through a web page and can also be exported in CSV or XLS formats.
Monitoring web page
The monitoring service (MAM) is embedded in the Imagicle on-prem UCX Suite and you can access it from web portal: admin ⇒ Monitoring.
Alarms tab
This web page shows a high level overview of Imagicle UCX Suite diagnostics, where the administrator can check cluster's synchronization (replication link status), HDD and SQL DB available space, Call Recording Digital Certificate and External Storage status, Webex Calling integrations authorization issues. See a screenshot sample below:
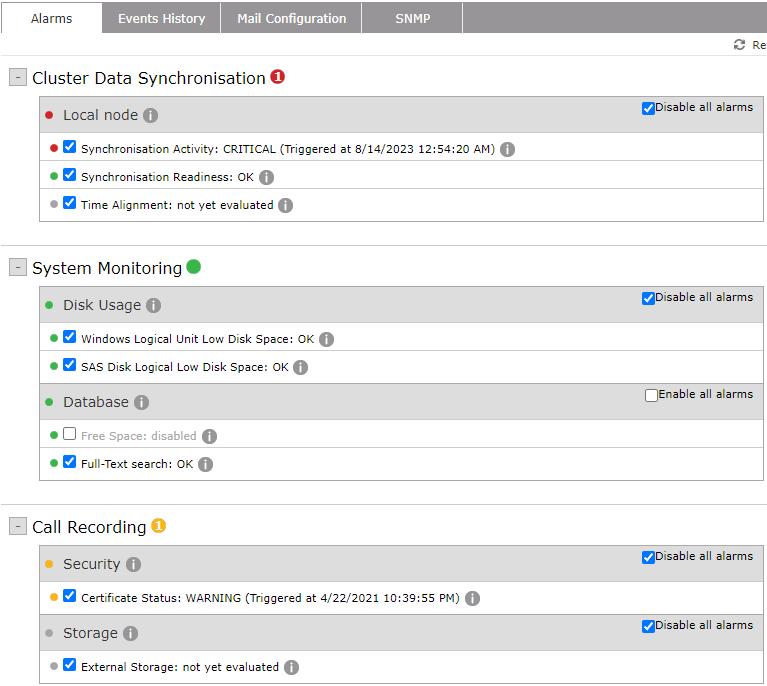
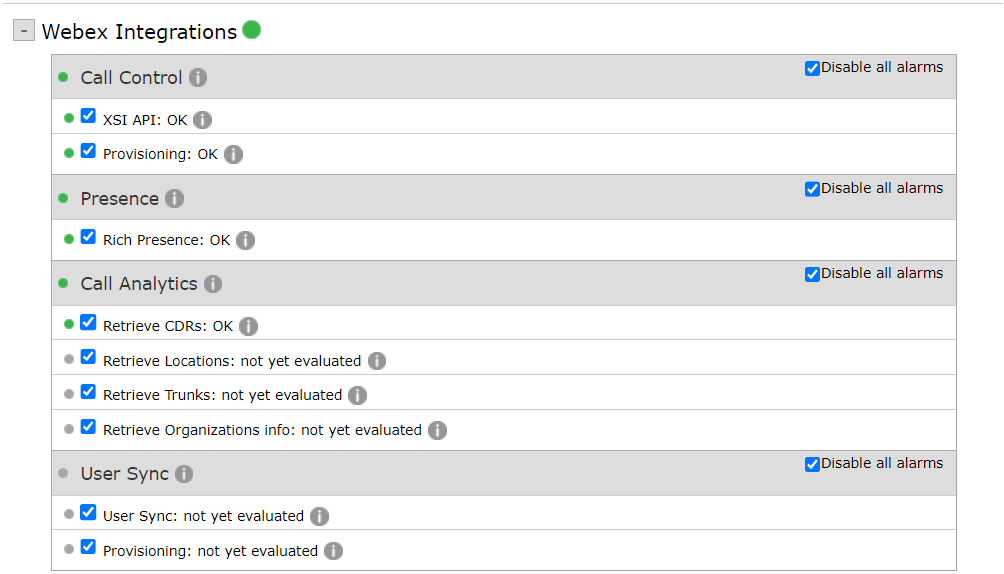
The administrator can selectively disable the alarms, if they are not needed. Warnings and errors are displayed here. To read the details of the current status, move your mouse over the grey "info" dot.
Events History
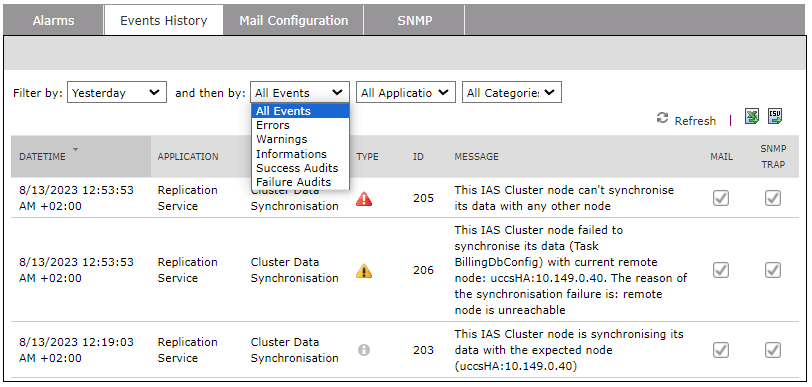
The list of events raised by the monitoring service and other Imagicle service can be examined through Events History web page. The controls on the top of the list allows you to filter the displayed events by date, by event type, by application and by category. Each event has an unique ID. See below screenshot sample:
Above events can also be browsed through the standard Windows Event Viewer.
The administrator can enable or disable notifications for specific events, by checking/unchecking relevant "MAIL" or "SNMP" flags.
The filtered list is dynamic. If an application, event type or category is not available in the list, this means that no event with that property has been raised yet. As a consequence, you can only disable events that have been notified at least once.
The list of events can be downloaded in CSV or XLS formats by clicking on relevant icons in the upper right corner of the list.
The monitoring service stores logged events for 30 days (default retention).
Email Configuration
Here you can set the list of email recipients of MAM Application and System events. Recipients addresses must be valid email addresses separated by comma.
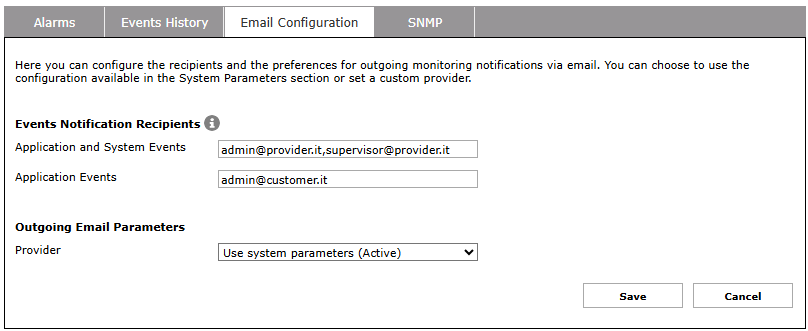
Please make sure that Outgoing Email Parameters have been correctly set for the email notifications to run. See here for more details.
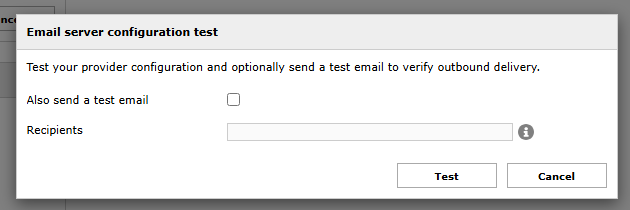
A “Test” button is available. If you hit it, a new window is popped-up where you can add one or more comma-separated email recipients and send a test email to all of them.
SNMP configuration
The SNMP configuration web page allows you to easily add the Imagicle UCX Suite server to a SNMP monitoring tool.
The Simple Network Monitoring Protocol monitor component is a third party software who receives the notifications from multiple monitored appliances within your network. Optionally, the software may include a master agent component which receives the notifications and makes them available to the monitor.
Imagicle MAM acts as a monitored appliance. No need to install a third party agent on Imagicle UCX Suite.
UCX Suite monitoring services only sends SNMPv2 trap services. It does not reply to SNMP queries.
Here are the parameters to activate the SNMP traps generation:
SNMP trap servers: enter the SNMP manager IP address; if more than one manager must be reached, enter relevant IP addresses separated by commas. If your system includes a master agent, enter the master agent IP address.
SNMP trap community: it is a common practice to put monitored devices in groups called communities. If this parameter does not match the configured community on the monitor, the trap messages are discarded.
Press Save to save changes.
To enable the third party SNMP monitor to receive the SNMP trap messages from Imagicle MAM, please download the SNMP MIB file by clicking on relevant button. MIB file should be loaded in SNMP monitor software. Please refer to your SNMP monitor documentation to know how to load a MIB file.
After configuration, whenever an alarm is raised, a SNMP trap is sent to the SNMP monitor. SNMP traps can be selectively disabled from the Events History web page.
If the Imagicle server fails (for example due of a power outage), no SNMP trap is generated.
SNMP traps are sent towards UDP port 162. Please ensure the SNMP manager IP address and port can be reached over the network, and no firewall is blocking the communication.
SNMP trap format on UCX Suite Winter 2026 and before
SNMP OID used for TRAP messages associated to Imagicle alerts are located in the Imagicle branch:
.1.3.6.1.4.1.39801 (.iso.org.dod.internet.private.enterprise.imagicle)
Events are identified as follows, through SNMPv2 OIDs:
39801.2.0.[eventid] (imagicle.suiteEventNotifs.[enterprise-specific].[eventid])
Events just include the following variable:
39801.1.1 (imagicle.types.eventText) (with a short text description of the events).
SNMP trap format on UCX Suite Spring 2026 and above
To grant a higher compatibility with several NMS applications, SNMP traps now include additional information that allows the NMS to recognize event severity and correlated events.
The types defined in the MIB file are the following:
Type OID | Type name | Description |
1.3.6.1.4.1.39801.1.1 | imagicle.types.eventText | Text providing a summary of the event. |
1.3.6.1.4.1.39801.1.2 | imagicle.types.severity | Event severity. |
1.3.6.1.4.1.39801.1.3 | imagicle.types.alarm | Alarm linked to the event. |
1.3.6.1.4.1.39801.1.4 | imagicle.types.application | Application linked to the event. |
1.3.6.1.4.1.39801.1.5 | imagicle.types.category | Category of the event. |
The variables sent in each trap are the following:
Name | Type | Included | Usage |
eventText | imagicle.types.eventText | always |
|
severity | imagicle.types.severity | always |
|
category | imagicle.types.category | always |
|
application | imagicle.types.applicaiton | always |
|
alarm | imagicle.types.alarm | if the event changes the status of an alarm |
|
Event-Alarm correlation
Latest MIB structure includes:
severity → severity of the raised event
critical
warning
info
alarm → alarm affected by the raised event
not all events have an associated alarm
all alarms have at least one associated event
the severity related to the event must also be considered as the new status of the associated alarm
How to interpret an event flow
Let’s see a sample scenario, considering a disk storage alarm and all the events correlated to it:
Alarm | Event |
WatchDog.LowWindowsDiskSpace | WindowsDiskSpaceCritical |
WindowsDiskSpaceLow | |
WindowsDiskSpaceAvailable |
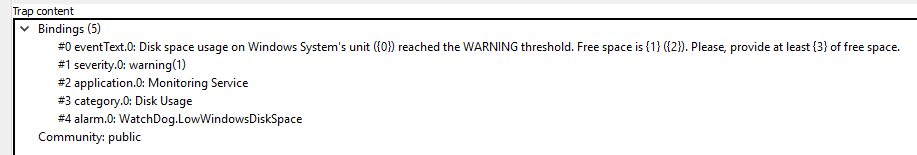
First notification (alarm status: warning):
[Warning] The disk free space is lower than the warning threshold.
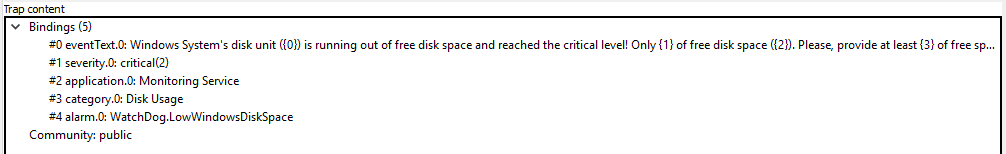
Second notification (alarm status: critical):
[Critical] The disk space is decreasing, reaching a critical condition. Must be sanitized ASAP.
Third notification (alarm status: cleared):
[Info] Following a disk cleanup, the disk space is returned to a stable condition.
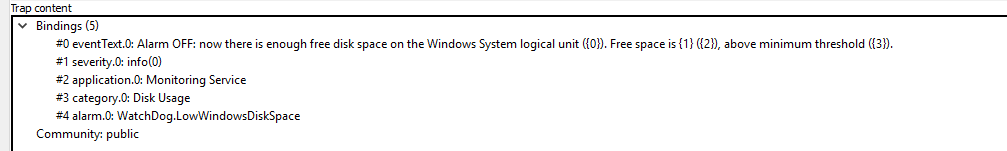
This is a typical alert sequence, where a warning notification becomes an alarm and eventually turns back to normal conditions.
Backward and forward compatibility
Upgrading an existing Imagicle UCX Suite to Spring 2026 or above does not impact the existing configuration in place on the customer’s monitoring systems:
Event OIDs are the same
if a new trap (including the new added information) is ingested in a system who’s not expecting the latest MIB definitions, it reports additional information, without knowing its types.
if an old trap (from an UCX Suite Winter 2026 or older) is ingested in a system already configured to recognizes the latest MIB definitions, the additional information are not included.
Troubleshooting SNMP trap messages
When you sent a test TRAP, the displayed result can be misleading. Check you can actually ping the configured SNMP manager or master agent IP addresses from the Imagicle server
To generate an application alarm, stop one of the licensed application Windows services (e.g. Imagicle Attendant Console)
Alarms shall be configured on the customer’s NMS by leveraging:
the
alarmvariable, for event correlationthe
severityvariable, for the correlated alarm current status.
Customer’s monitoring configuration must be aware that not all events have an
alarmvariable set: in this case, the traps must be treated as plain events, not influencing alarms status.