The Overview section, included in the Analytics tab, will show a quick summary of all Analytics features through the following sub-sections.

Number of conversations last 7 days. You can easily identify trends and the exact number of client conversations (y-axis) on specific calendar days (x-axis). For example, in the graph below, you'll notice that during the weekend of April 20th-21st, the number of client conversations was particularly low due to fewer operators being on duty. In contrast, on April 22nd, agents handled a peak of 34 conversations with users.

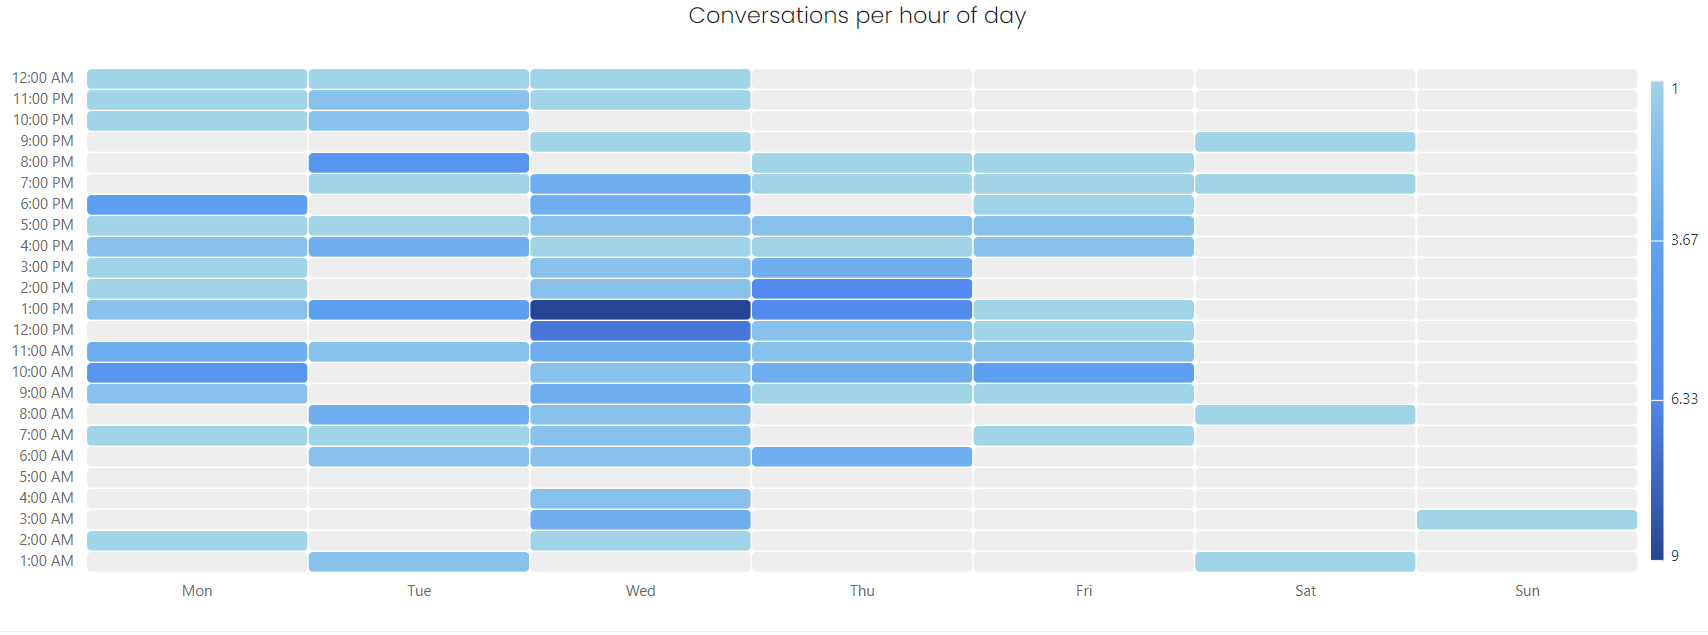
Conversations per hour of day. If you scroll down, you'll find the table that points out what are your busiest hours (identified by dark blue on the y-axis), as well as your not-so-busy hours (light blue) on specific days of the week (x-axis). This can be particularly helpful if you're trying to figure out a rota for your agents based on your average client demand during certain shifts.
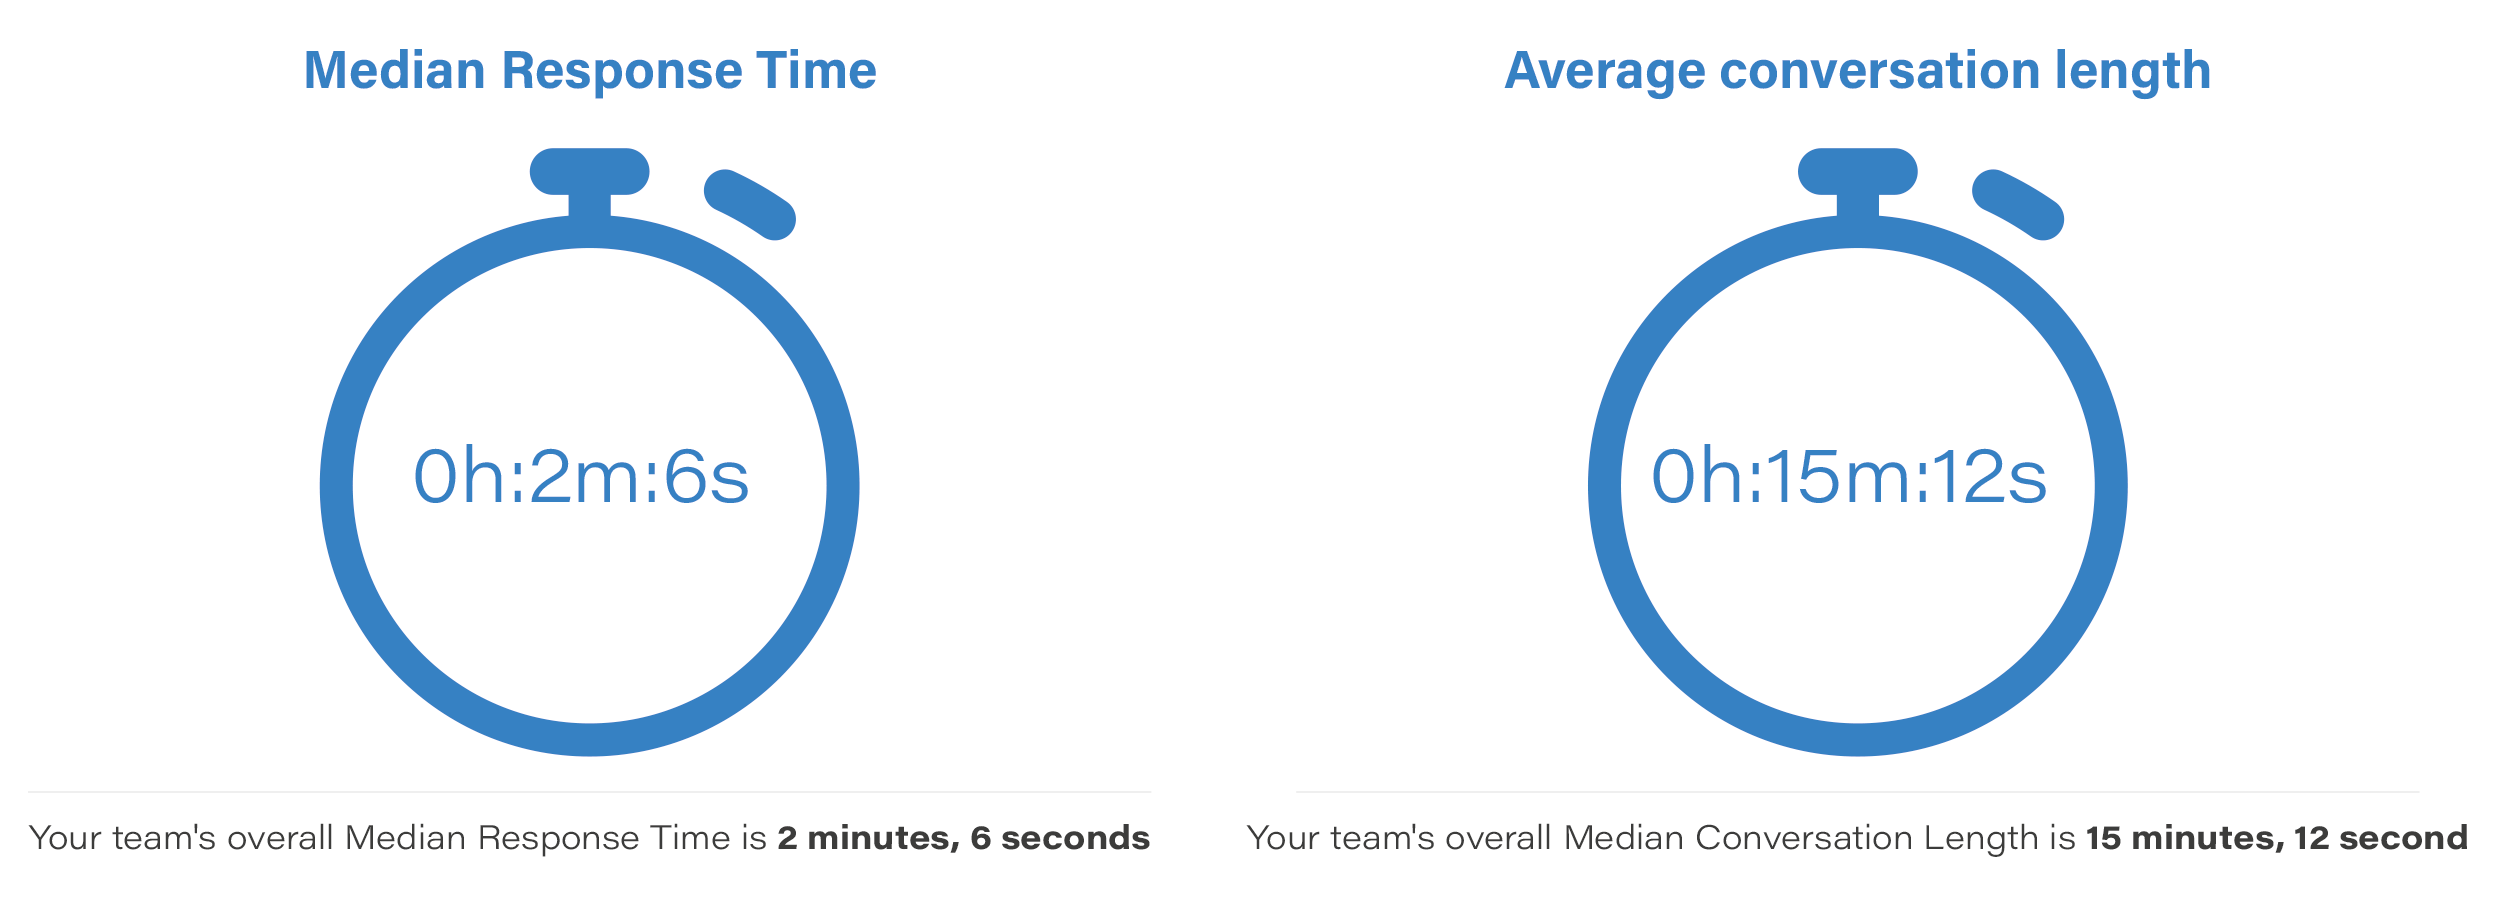
Median Response Time & Average conversation length. Finally, at the end of the Overview section, you'll see what is the median response time of your agents, once they've been contacted by a client as well as how much time was needed on average to close (or Resolve, as we call it) a client conversation. This is particularly useful if it appears that you ought to improve your agents' responsiveness. PRO TIP: to decrease the average conversation length, don't forget to Resolve (archive) your client conversations as soon as they come to an end.