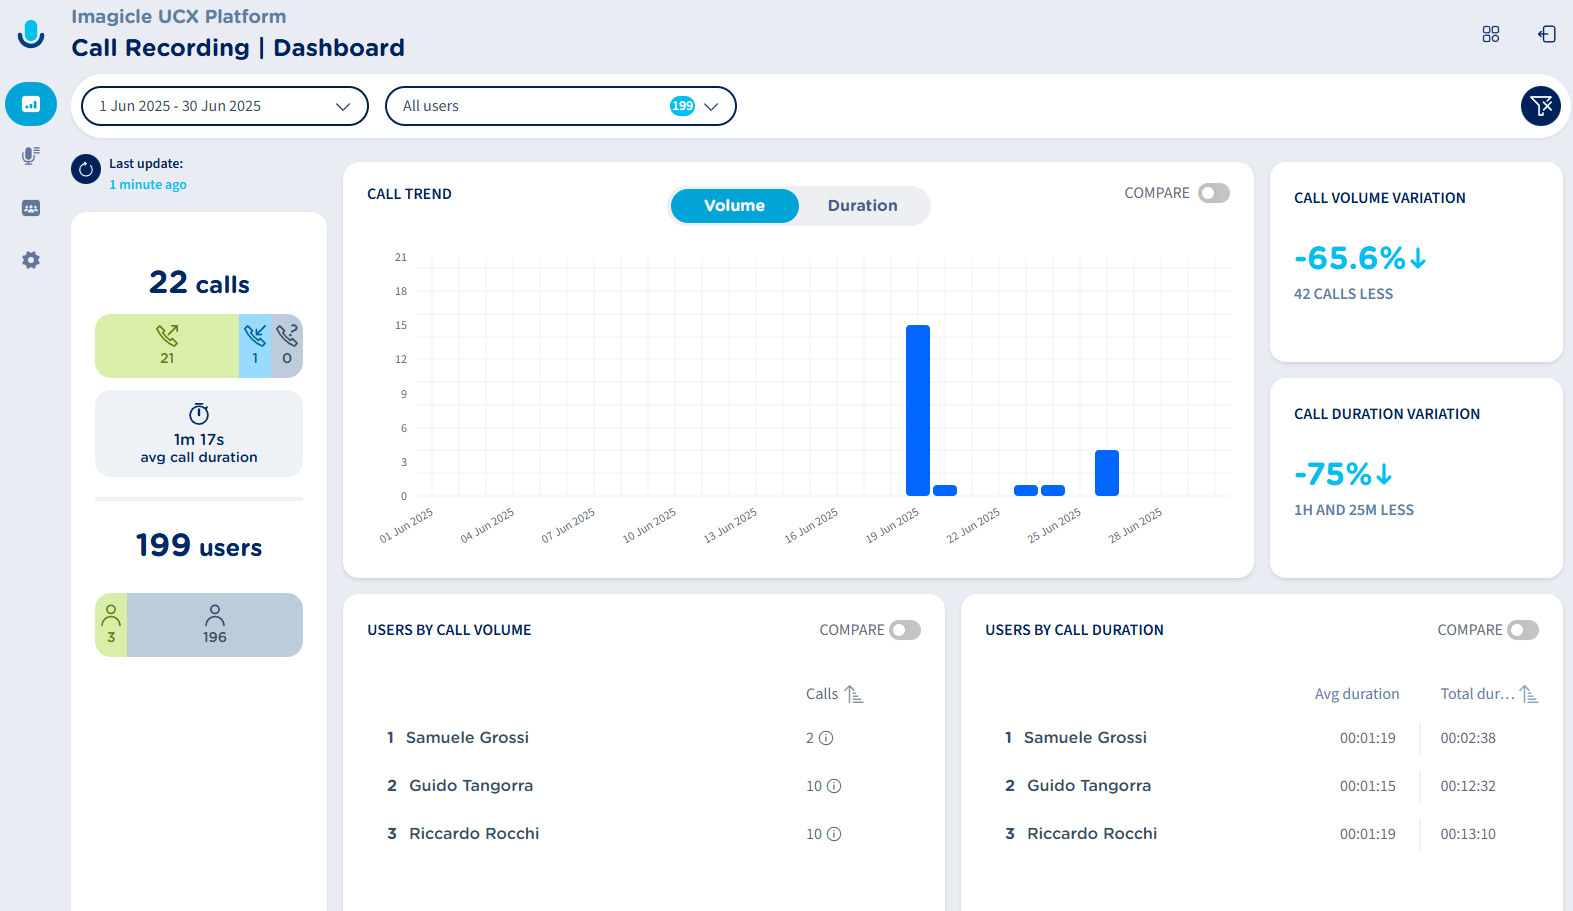
First page appearing when the Admin accesses to Call Recording is the Dashboard page, which shows statistical data about the users’ behaviors, in terms of volume of recorded calls and relevant duration. Below you can see an Imagicle Call Recording Dashboard sample:
On top page header, you can apply multiple filters on collected conversations:
-
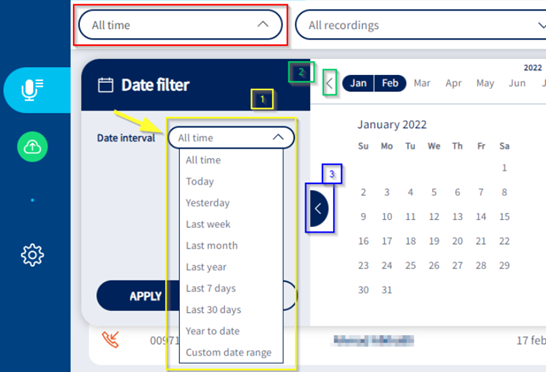
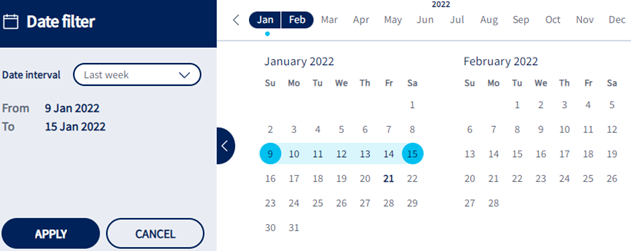
Date filter → Filter by a predefined time interval or by a custom date range. See below:
-
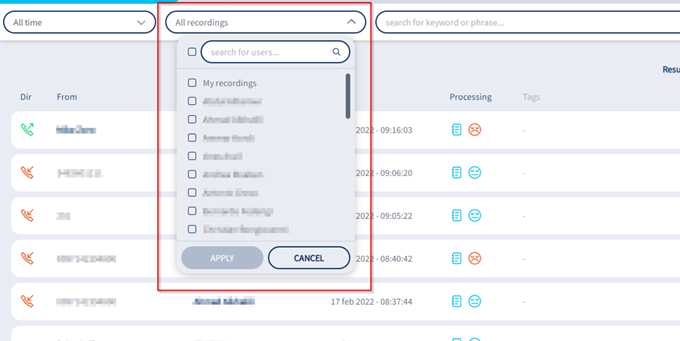
Users’ filter → Allows to apply a filter to consider recorded conversations performed by specific users only. See below:
-
Funnel icon
Analyzed data involves all selected users and it provides three “widgets” including different data:
Overall Recording counters
Left side panel displays overall number of recorded conversations, split in a slider graph by inbound (cyan) and outbound calls (green).
Below these counters, you can find the average call duration.
Below average call duration, you can find the total number of recording users and how many of them have recorded conversations (green).
Call Trend
This widget includes a graph representing recorded calls trends of those conversations included in applied time frame, by volume and call duration selectable levels.
X-axis represents selected time frame, where a proper time unit is applied depending on filtered time range: hour, day, week, month.
On top of the widget you can find two buttons, to toggle Volume and Duration graph patterns.
COMPARE switch on top-right allows to show or hide trend patterns related to previous adjacent time frame. Previous time frame trend patterns are displayed with light blue bar chart for Volume and dotted line for Duration. If you hoover mouse pointer on this widget, additional data is displayed:
-
Applied time frame and adjacent previous time interval, considered to display relevant trend patterns.
By double-clicking on any Volume or Duration graph bar/line, you are redirected to the Recordings page, where the list of recordings relevant to the graph item is displayed.
Call Volume/Duration variations
Two widgets are included in the right side of the Dashboard, to provide the variation between selected time period and previous adjacent period. This is useful to understand the users' behavior in terms of number of recorded calls and relevant calls duration relative incremental data.
Users by Call Volume/Duration
Two additional widgets are included in the Dashboard, to provide:
-
Users by Call Volume → List of users sorted ascending/descending by amount of recorded calls. Info ballon help are available to display the amount of incoming/outgoing call counters.
-
Users by Call Duration → List of users sorted ascending/descending by total recorded calls duration. For each user, average call duration is displayed too.
COMPARE switch is available in both above widgets, to show or hide volume/duration data related to previous adjacent time frame. Previous time frame variations in percentage are displayed in cyan.
You can click on any user’s entry, to be redirected to the Recordings page, where the list of recordings relevant to that user is displayed.
Agent Scoring panels
If Evaluation Surveys feature is in use and you own a Call Recording PRO license, then the following additional widgets are displayed in the dashboard:
Users By Agent Score
The Users By Agent Score widget displays an agents ranking based on their score for the selected date range. The widget displays only the agents included in the Dashboard filters. The score associated to each agent corresponds to the average Agent’s Score within the selected period. If a recording has no score it is not included in the computation. See below sample:
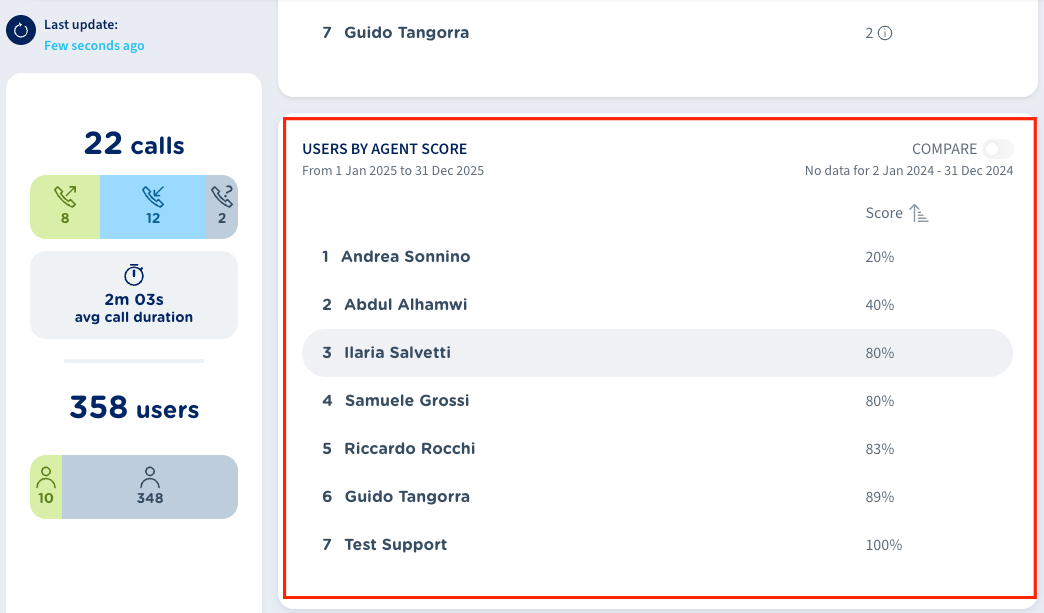
By default, agents are ordered in ascending order, from the lowest score to the highest. A toggle button is available on top-right to reverse the sorting order.
The widget also allows to compare the current Agent Score with a previous period. The COMPARE toggle switch on top-right allows to show/hide the KPI percentage difference versus the selected comparison period, if data is available.
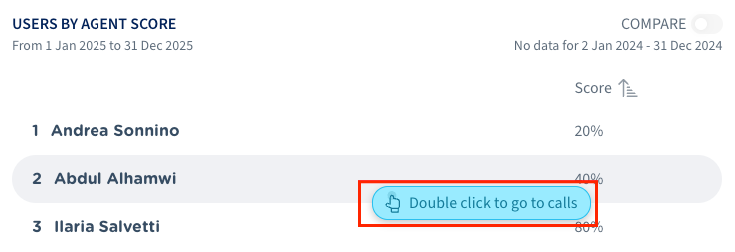
Drill Down to Recordings
Supervisors can drill down into more details by double clicking on a specific agent line within the widget. When an agent is selected, the system redirects to the Recordings Page, automatically filtered by current time period set in the Dashboard and by selected agent. See below sample:
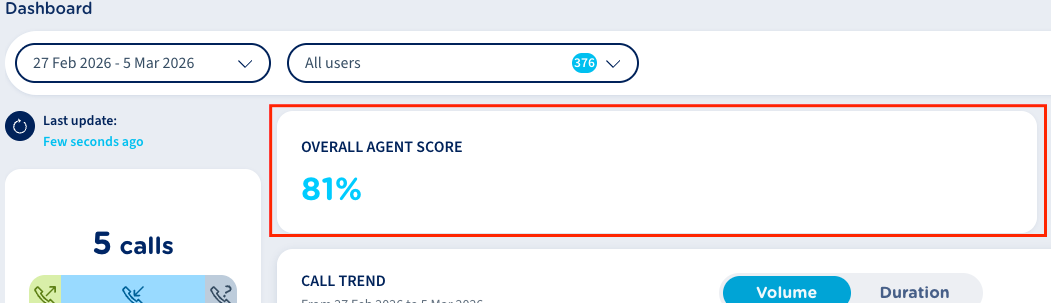
Overall Agent Score
This widget displays the Overall Agent Score KPI across all scored recordings available for the current filter selection. The value updates automatically whenever the Dashboard filters change, so it always reflects the current selected users and time period. If there is no scored recordings for the selected agents/period, the widget just displays a dash “-”. See below sample:
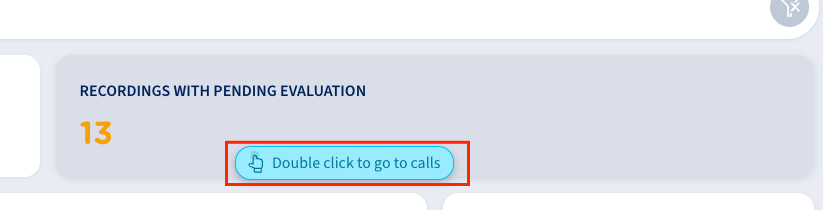
Pending Evaluation Recordings
The widget displays the count of recordings that have pending evaluation for the selected date and users' range filter. A recording is considered pending evaluation when it has at least one survey in pending status.
Hovering mouse over the counter reveals a Drill down action. Selecting Drill down redirects you to the Recordings page, automatically filtered to show only recordings with pending Survey Status. This allows supervisors to resume their duty directly from displayed recordings list.
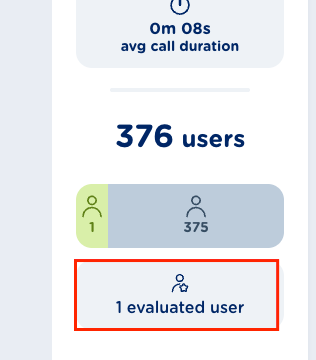
Evaluated Agents
This counter available on the left side panel displays the number of evaluated agents for the selected date and agents' range included in Dashboard filter. Agents are tagged as evaluated when they have at least one survey with score submitted in the selected period. See below sample:
Score Trend
This widget provides the score trend expressed as the average of the supervisor’s recording evaluations across all calls of the selected agents/time period. Score trend is available as an additional tab within the Call Trend widget. If the user is not a supervisor, or if the customer does not have the agent scoring feature enabled, this tab is not displayed.
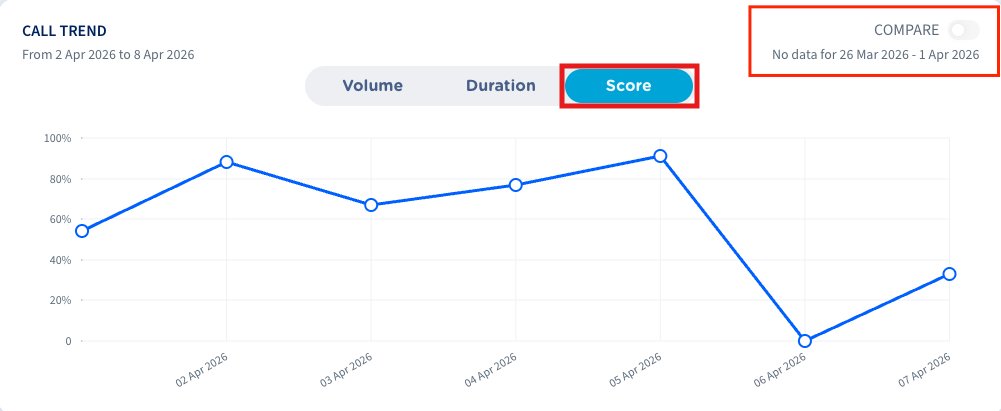
If data for the previous period is available, COMPARE toggle switch is enabled on top-right and the description indicates the period used for the comparison. Once enabled, the chart displays the previous period as a dashed line.
When hovering over the chart, a tooltip is displayed showing the percentage value and the date. Double-clicking the tooltip redirects the user to the recording list, filtered by selected users and tooltip date.
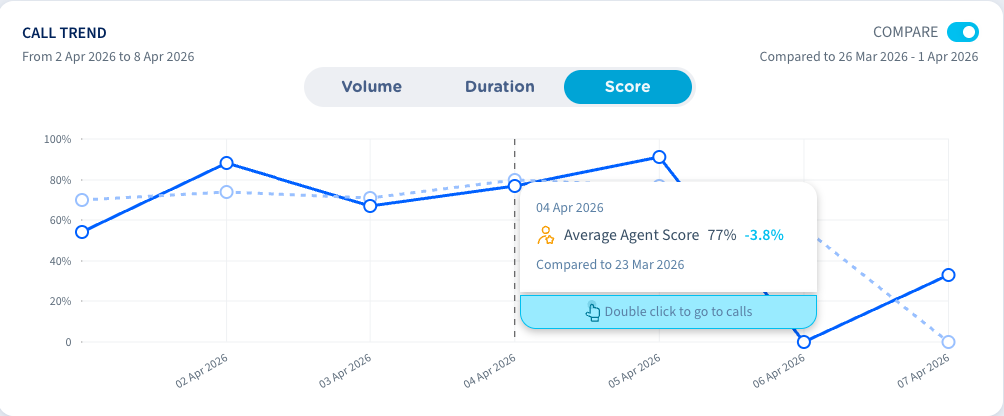
The Average Agent Score included in the chart is calculated as the average score percentage which has been evaluated by the supervisor.