Providing you own an Imagicle Call Recording AI Insights license profile, your Call Recording Dashboard page includes additional items about users’ behaviors, in terms of sentiment analysis trends. Below you can see a Dashboard sample:
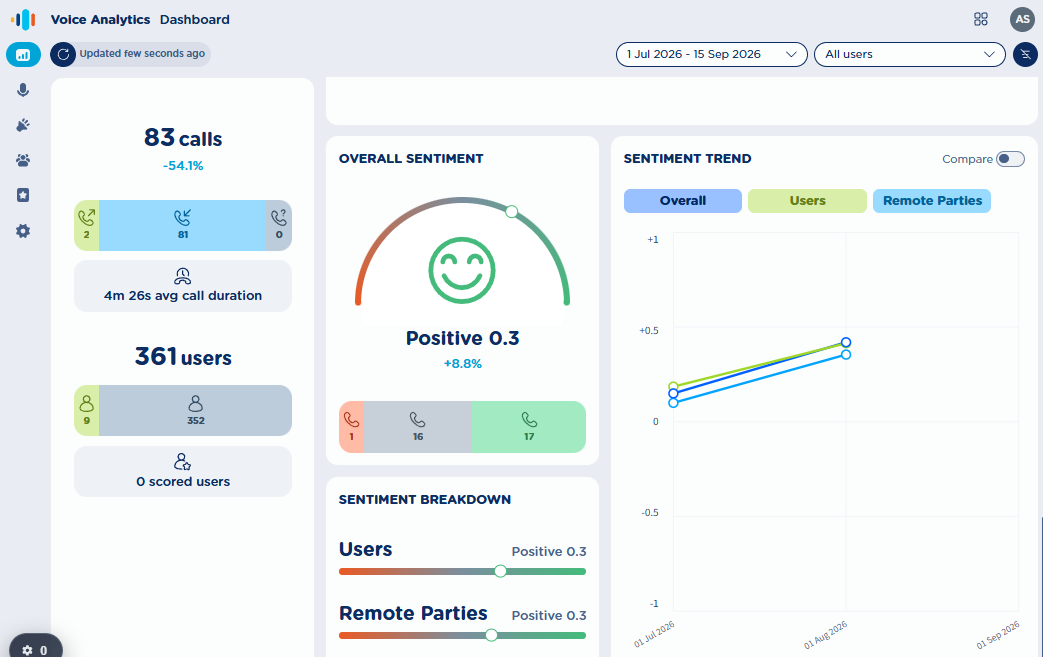
On top page header, you can apply multiple filters on collected conversations and relevant sentiment data:
-
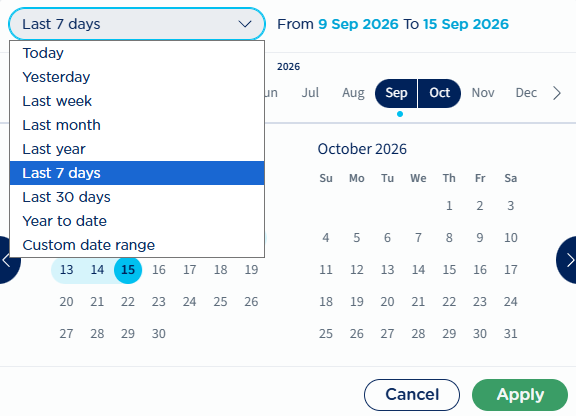
Date filter → Filter by a predefined time interval or by a custom date range. See below:
-
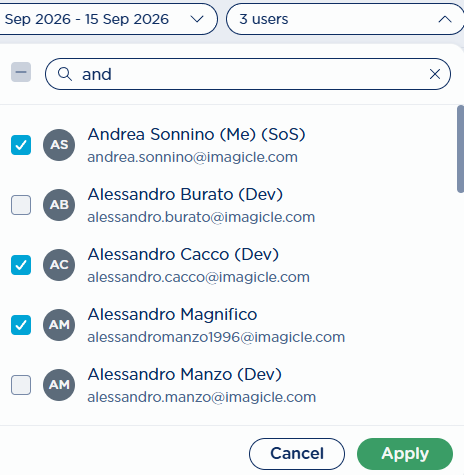
Users’ filter → Allows to apply a filter to display recorded conversations performed by specific users only. See below:
-
Funnel icon

Analyzed data involves all selected users and it provides three “widgets” including different data:
Overall Sentiment
Embedded gauge graph represents sentiment average level of those conversations included in applied time frame, with an incremental/decremental percentage against previous adjacent time frame.
In the lower part of the widget, three counters are respectively showing the number of negative, neutral and positive calls.
If you hoover mouse pointer on this widget, additional data is displayed:
-
Applied time frame and adjacent previous time interval, considered to calculate the incremental/decremental percentage.
-
An up or down arrow indicating an overall increase (more positive) or decrease (more negative) of sentiment value.
-
Sentiment value range, between -1 and +1
Sentiment Breakdown
Embedded slider graph represents sentiment average levels of those conversations included in applied time frame, referred to local party (user) and remote party.
If you hoover mouse pointer on this widget, additional data is displayed:
-
Applied time frame.
-
Sentiment value range, between -1 and +1
Sentiment Trend
This widget includes a graph representing sentiment trends of those conversations included in applied time frame, at overall, local party (user) and remote party selectable levels.
X-axis represents selected time frame, where a proper time unit is applied depending on filtered time range: hour, day, week, month.
On top of the widget you can find three buttons, to toggle Overall, Users and Remote parties sentiment graph patterns. By default, Overall pattern is displayed, but you can turn on all of them or just select the required one(s).
COMPARE switch on top-right allows to show or hide trend patterns related to previous adjacent time frame. Previous time frame trend patterns are displayed with dotted lines. If you hoover mouse pointer on this widget, additional data is displayed:
-
Applied time frame and adjacent previous time interval, considered to display relevant trend patterns.
Placing mouse pointer on X-axis time units intersecting trend patterns, pops-up a detail panel including filtered time frame and sentiment values of selected graph patterns (Overall, Users and Remote parties) in the specific date/time.
Topics widget
If Summary & Topics feature is enabled, you can find a word cloud with the 15 most recurring topics for the selected time range and users.
Double clicking on a topic, you are redirected to the recordings page with a filter applied on datetime range, selected users and the topic you clicked on. See below sample: